Introduction(Harun)
Project Overview:
Summary
Goal
The Excel tool
Literature Review & Data Collection:
Reading on Rural Grocery Stores
Selecting data to automate
Methods
Market Size Calculation (Alex)
Market area calculation
Quarter Circle
Voronoi
Reillys
Population
Rural Population
Metro Population
Town Population
Revenue Estimation
Estimating the revenue is important for calculating the overall profit of a store. The functions in this section of the package estimate the total revenue of a store using the estimated market size, three different shopper type categories, and the average per capita spending on groceries.
Average Grocery Spend
The average per capita grocery spend is the average money each person in the US spends on groceries per year. This value acts as a baseline for how much we can expect each shopper to spend in a store. We created three functions that calculate this value and adjust for inflation.
First, we calculate the average per capita grocery spending for 2022 by dividing the total grocery sales from IBIS by the total US population as of 1/1/2023. This is done by the function
Avg_Capita_Grocery_Spend(). Since it is calculated for 2022, it should be adjusted for inflation from the base year(2022). CPI and RPP does this adjustment to the value in the functionsAdj_Capita_Grocery_Spend()andState_Adj_Capita_Grocery_Spend(), respectively.Consumer Price Index(CPI): Measure of the average change over time in the prices paid by urban consumers for a market basket of consumer goods and services. So, adjusting according to the CPI accounts for the overall inflation in the US.
Regional Price Parities(RPP): Measure the differences in price levels across states and metropolitan areas for a given year and are expressed as a percentage of the overall national price level. This value is 100 for the overall US, and it is lesser or higher than 100 depending on if the state’s price levels are lower or higher than the national average. Adjusting according to this measure gives that state’s average per capita spending on groceries for that year.
Update and Maintenance
Variable name Frequency Source Link Notes Total US Grocery Sales Optional IBIS Default base year is taken as 2022 Total US population Optional US Census Bureau Default base year is taken as 2022 Estimated cumulative price increase(CPI) Yearly update/ Half yearly update US Bureau of Labor Statistics https://data.bls.gov/timeseries/CUUR0000SA0 CPI in the current year - CPI in the base year
For now, defaulting as 7 for 2023
State Index Yearly update BEA https://tinyurl.com/2wvca7vy The value is taken according to the store location. Money spent by different categories of shoppers:
Since not all shoppers will have the same level of preference for all stores, it is important to consider and add weight to the proportion of money spent. To do this, the shoppers are classified into:
Primary Shoppers: The people doing most of the household grocery shopping in that store.
Secondary Shoppers: Regular visitors for smaller purchases but will often do their weekly shopping elsewhere.
Rare Shoppers: People who are very occasional shoppers(only when necessary).
Shopper choosing a store as a primary store or not depends on many factors, one of the main ones being distance and accessibility. So we classify the markets based on distance or location into:
Metro: The population of the city in which the store is planned to open
Town: Population of all the cities in the market
Rural: Total rural population of the market
From the above classifications, it would be reasonable to expect more primary customers from metro markets than from elsewhere because of the proximity. So the weight is added using the default percentages of primary, secondary, and rare shoppers from the different markets.
Primary Secondary Rare Metro 50% 40% 10% Town 30% 50% 20% Rural 30% 50% 20% The total number of primary, secondary, and rare shoppers is calculated by multiplying the corresponding percentage with our market’s metro, town, and rural population calculated in the previous section. This calculation is done in the functions
Primary_Shoppers_Count(),Secondary_Shoppers_Count(), andRare_Shoppers_Count().As Primary shoppers do most of their shopping in that grocery store, the percentage of the average they spend(60%) is much more than that spent by the secondary shoppers(25%) or rare shoppers(5%). The total spend for each category of shoppers is calculated individually by the functions
Total_Spend_Primary_Shoppers(),Total_Spend_Secondary_Shoppers(), andTotal_Spend_Rare_Shoppers()by multiplying the percentage, number of shoppers, and average grocery spend.Total Revenue
The function,
Total_Estimate_Revenue(), calculates the final total estimated revenue by summing the outputs from theTotal_Spend_Primary_Shoppers(),Total_Spend_Secondary_Shoppers(), andTotal_Spend_Rare_Shoppers().Grocery Sales Visualizations:
As discussed before, a shopper choosing a store as a primary store or not depends on a lot of other factors like the competition from the big chain grocery stores, other non-chain grocery stores, and dollar stores, which provide them a cheaper alternative. So to understand how the store location and presence of competitors affect a store, we analyzed the Sales Genie’s data on dollar stores and grocery stores in Iowa. We classified the cities in our data set according to the city group classification based on population and adjacency to a big city. This classification classifies the cities into these eight groups:
Group 1: 10,000 or greater Core county of a metropolitan statistical area (MSA)
Group 2: 10,000 or greater Non-core MSA county or non-metropolitan county
Group 3: 2,500 to 9,999 Non-metropolitan county
Group 4: 2,500 to 9,999 Metropolitan county
Group 5N: 500 to 2,499 Non-metropolitan county, not adjacent to an MSA
Group 5A: 500 to 2,499 Non-metropolitan county, adjacent to an MSA
Group 6: 500 to 2,499 Metropolitan county
Group 7: 250 to 499. Any county
Rest of State: 249 or fewer Any county
Of these, we specifically focused on the cities with a population of less than 2500 and created a plot that shows the number of the different types of stores in each city group classification.
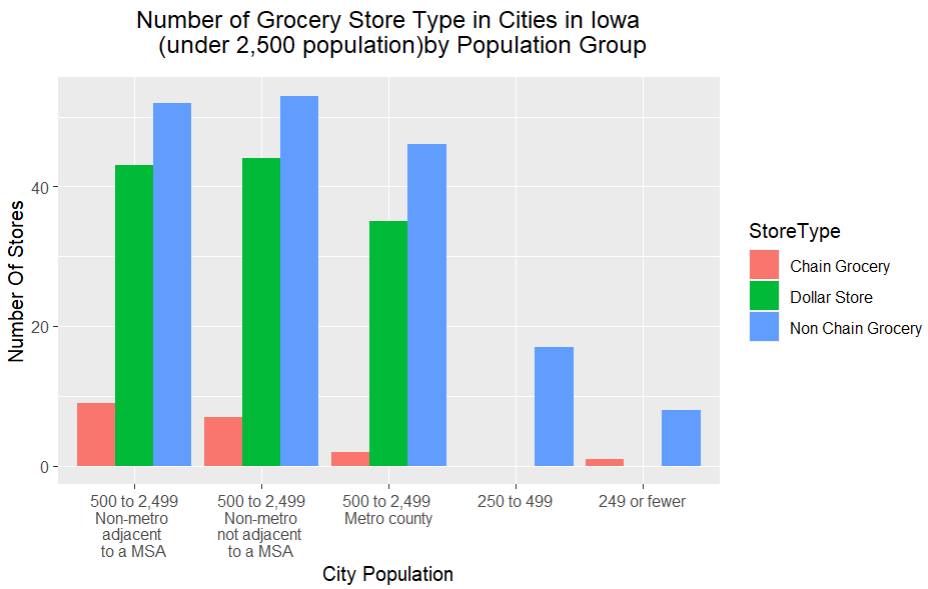
We see that there are very less chain grocery stores in all these cities with a population of less than 2500. As we go more and more rural, the only competition in the city is from the other non-chain grocery stores in that area. The distribution of the sales volume for various non-chain grocery stores is also shown in the dashboard. These visualizations will help small rural grocery business owners to design their stores depending on the preexisting competition.
Expense Estimation (Aaron)
Expenses for Opening a Store
Cost of Goods Sold
Operating Expenses
Asset Depreciation
Loan Interest
Rent
Secondary Sources of Income
Income from interest
Other income
User-defined Inputs
Switching between multiple ownership scenarios
Input their own percentage values as sliders
The assets list can be customized to calculate depreciation
Custom loan and rent
Pre-Tax Profit Calculation
Design Choices (Harun)
Results (Harun)
- Dashboard Demo
Conclusion
Through continuous improvement, our tool presents a significant opportunity to combat food deserts, giving small rural business owners the means to create sustainable grocery stores and uplift their communities. We can implement better ways to calculate the market size (like Voronoi and Reillys), include start-up costs while estimating the expense, and give users more information about other credible resources that can help them.