library(ggplot2)
sales_chain_grocery <- ggplot(data = chain_grocery_store_data, aes(x = Location_Sales_Volume_Range, fill = Company_Name)) +
            geom_bar(position = "stack")+
  ggtitle("Location Sales Volume distribution for Chain Grocery Stores") +
  xlab("Sales Volume Range") + ylab("Number of Stores")+
  theme(axis.text.x = element_text(angle = 90, hjust = 1))
ggplotly(sales_chain_grocery)Function Recreation
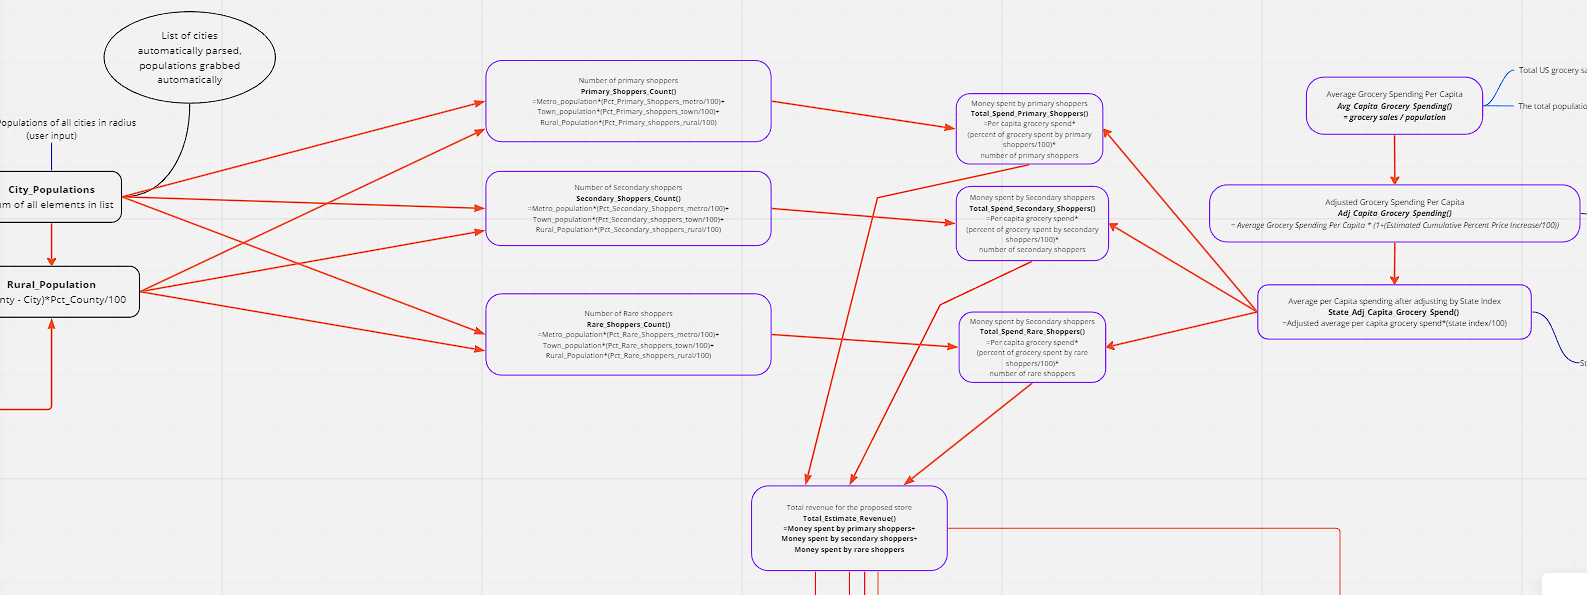
We wanted to start with recreating the functions from Excel into an R package so that we could think about automation and edition later. I worked on the Market Revenue calculations sheet, which was highly dependent on the output from the Market Size Calculations Sheet. So initially, to visualize the flow, I created a flow chart using Miro to map how the functions are linked. I set some default percentages for the share by the primary, secondary, and rare shoppers to the total market revenue, which the user can alter if they want to.
Difficulty in the process
Figuring out the State index and percentage price increase values took a lot of my time after I created the functions. I shortlisted some of the resources that I found can be useful, like the CPI(Consumer Price Index), PPI(Producer Price Index), RPP(Rural Price Parities), and Cost of Living index. What made it more confusing for me was that some of these had values specifically for groceries other than the overall value. After discussing with Duane(our client) in our last meeting, I chose to use the Consumer Price index, which is the measure of the average change over time in the prices paid by urban consumers for a market basket of consumer goods and services, as the estimated price increase, and use Rural Price Parities, which measure the differences in price levels across states and metropolitan areas for a given year and are expressed as a percentage of the overall national price level, as the State Index.
Update and Maintenance
I created the following table to Track the source and links about the variables used and how frequently it is required to be updated.
| Variable name | Frequency | Source | Link | Notes |
| Total US Grocery Sales | Optional | IBIS | Default base year taken as 2022 | |
| Total US population | Optional | US Census Bureau | Default base year taken as 2022 | |
| Estimated cumulative price increase(CPI) | yearly update/ Half yearly update | US Bureau of labor statistics | https://data.bls.gov/timeseries/CUUR0000SA0 | CPI in current year - CPI in base year For now defaulting as 7 for 2023 |
| State Index | yearly update | BEA | https://tinyurl.com/ycwpjzwz |
The consumer Price index is updated every month, but it is fine to take yearly once or twice because it does not change each month very much. And for the Rural Price parities, the latest data that we have is 2021 because it is economic census data and is not available for the recent 1 year.
Visualizations
After finishing the recreation of the function in R, I started working on making some visualization to display in the dashboard of the tool. I used Plotly for making these visualizations because I think it is a simple way to make interactive plots in R. I was working with the Sales Genie Data sets about the grocery stores and dollar stores in Iowa. I also looked at the Google API data set for the dollar store data in Iowa and Illinois.
Sales Genie Data Set Vs Google API data set
Most of the visualizations that I created were using the sales Genie Data Sets. Although one problem that I noticed was that it could possibly be missing some stores. I noticed this when I was trying to plot the number of stores in each Dollar Store chain using both the Google API data set and the Sales Genie Data set.
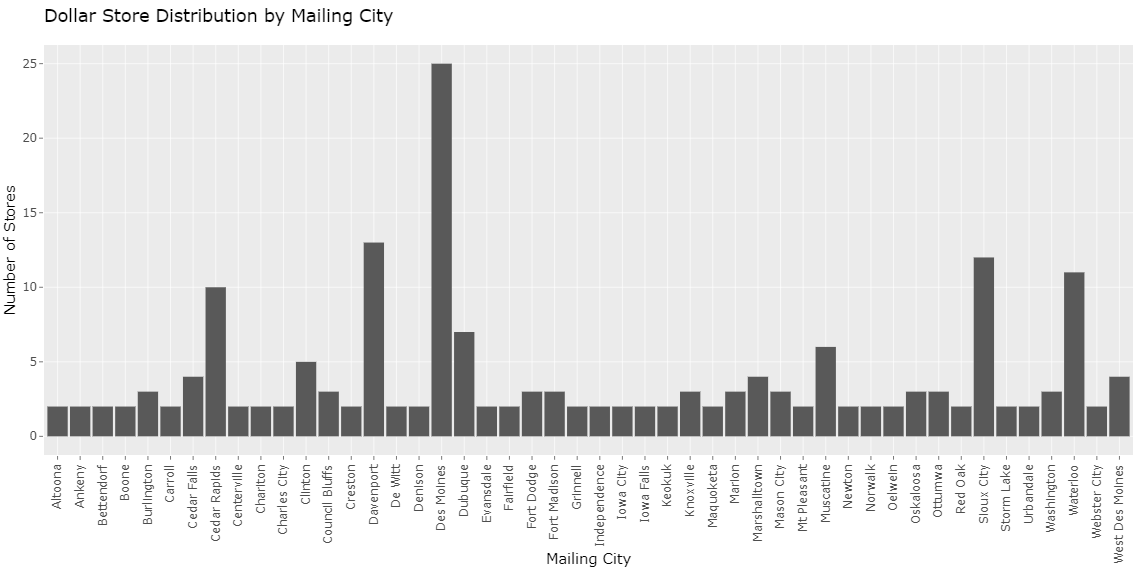
The above plot shows the number of cities in Iowa with more than 1 dollar store plotted using the Sales Genie Data Set. We notice that Ames is not there, although there are 2 dollar stores in Ames.
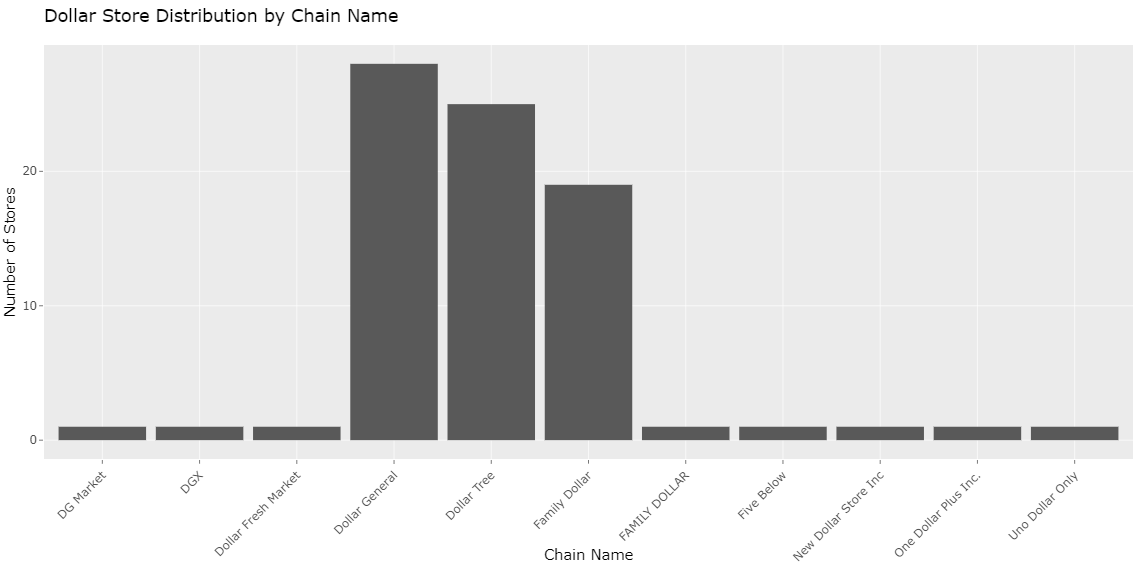
When I saw the Google API data set to check this, it was also incorrect, saying there are 4 dollar stores in Ames. When I looked at the data table, I found that it had a store which was near Ames, which had the mailing city as Ames. I have more difficulty with the Google data set is that it is not cleaned it has some dollar generals as DG market and differentiated based on name than on chain like shown in the below plot:
The following plots show the distribution of stores in cities of Iowa with more than one chain grocery store and non-chain grocery store, respectively. I am currently working on improving this plot by trying to make a single plot that contains the distribution of the stores color-coded by the type so that we can see if there are any trends that we can observe about the presence of one type of store affecting the other(like if dollar stores affect the non-chain grocery stores).
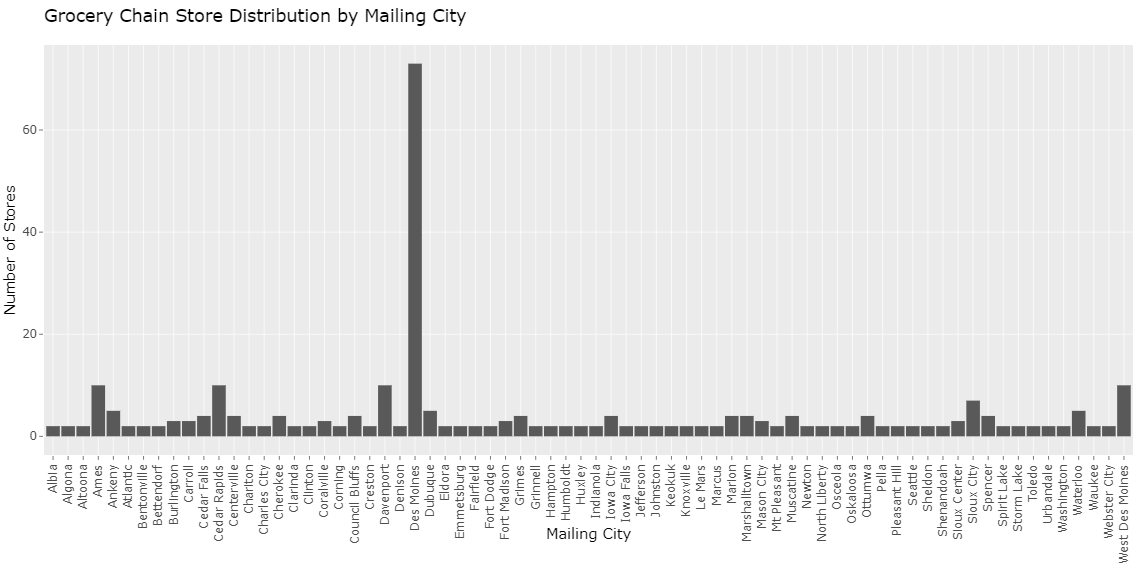
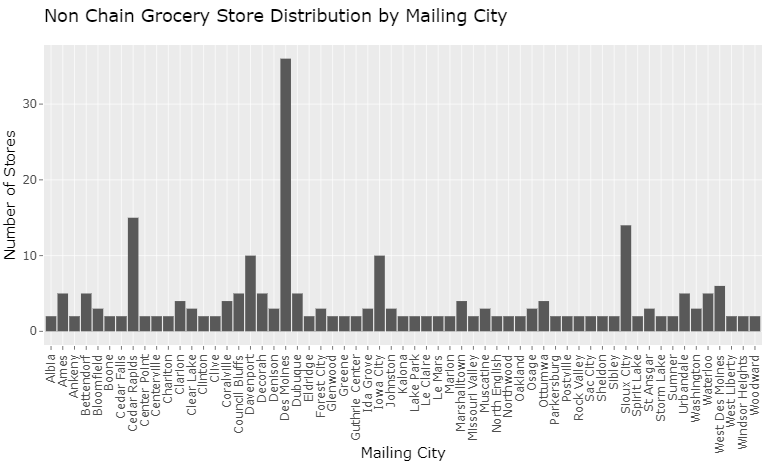
From all these plots, one common thing that we can observe is that irrespective of the type, there are usually more stores in big cities than in small cities, as we would expect.
Sales Volume Distribution
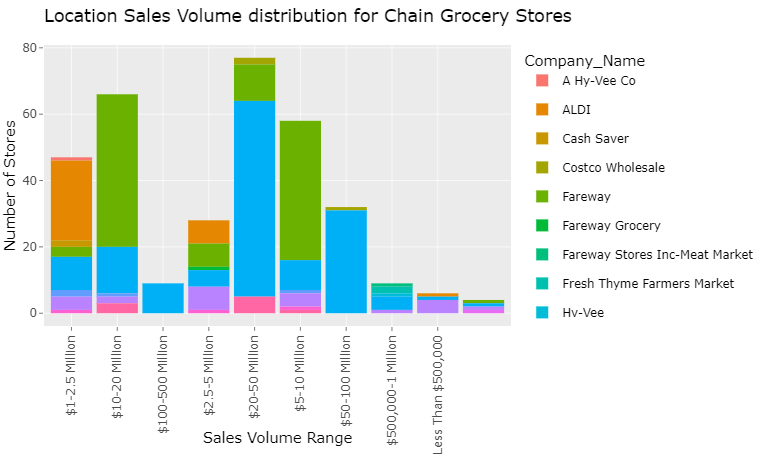
The above plot shows the distribution of the number of stores by Sales volumes for the major chain grocery stores in Iowa. I must do data cleaning and arrange the x-axis titles in ascending order to make them more interpretable.
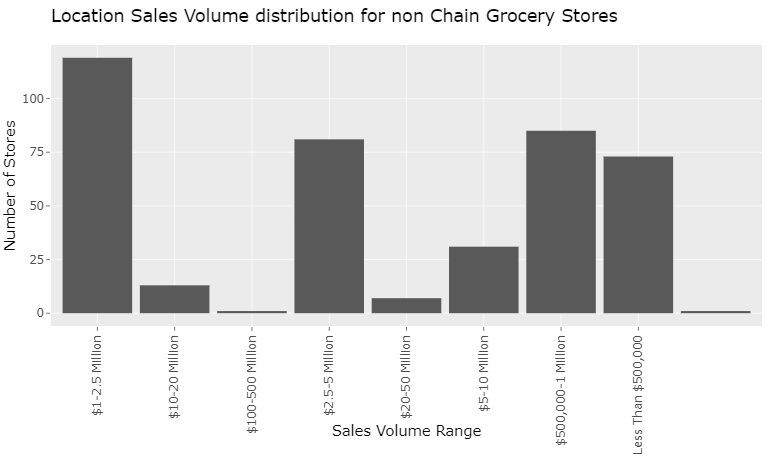
The plot shows the location sales volume for the non-chain grocery stores. We can see that many of the non-chain grocery stores have a 1-2.5 Million sales volume.
Working on
Matching the city names in the Sales Genie Data Set to their counties so that we can make a plot classifying the stores based on their location classified by the RUCC(Rural-Urban Continuum Codes) code.