The major task of this week was to test run the functions created last week. I also found possible sources to get the state index and Percentage price increase, 2 parameters we were unsure of from the previous work. I also went to the GIS conference in Des Moines on Thursday.
Testing Functions
I used the sample case given in the client’s Excel to test the functions. Corrected some functions and floored some output values to give a better estimate.
Visualizations of the dollar store Data
I got data from 2 different sources. I created visualizations about the distribution of the different dollar store chains using Plotly in R.
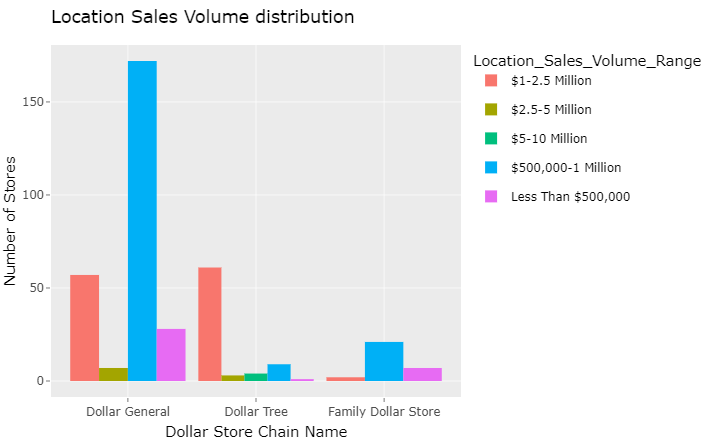
The above plot shows the location sales volume ranges for different dollar store chains in Iowa, like Dollar Tree, Dollar General, and Family Dollar Store.
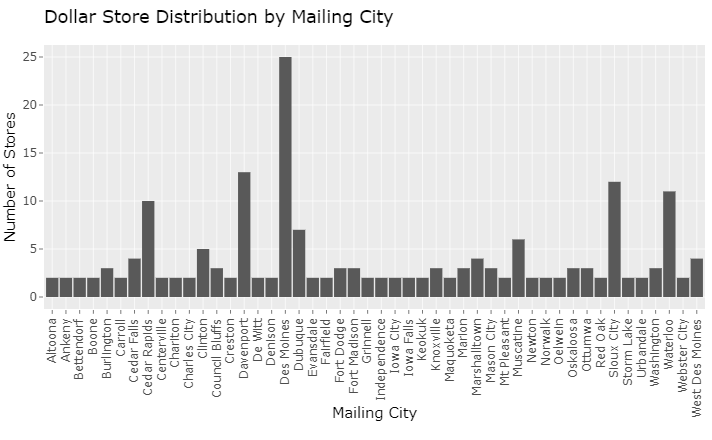
The above plot shows the cities in Iowa with more than 1 dollar store. Des Moines, as expected, has the highest number of dollar stores.
Coffee Talk
This week on Wednesday, I did a coffee talk about the YouTube Studio Analysis. As a YouTube content creator, spending time looking at the various analytics is interesting and insightful. I shared with the DSPG team about the various analytics I could look at in the YouTube Studio and how this data-driven approach enables me to create content that resonates with their target audience, leading to increased engagement and growth on the platform.
Client Meeting
We had a Client meeting in the afternoon. I got the opportunity to clarify my doubts regarding percentage price increase and State index, the 2 variables that were confusing for me in the Estimating Revenue sheet shared by the Client. When I showed the sources I got, he reviewed them and clarified that the Consumer price index could be used as the percent price increase and Regional price parities as the State index. I also clarified the 2 different methods he used to calculate the Avg per capita grocery spending in the US. This meeting was very useful in proceeding forward with the project.
GIS Conference
On Thursday, we went to the GIS conference in Des Moines. I attended the following presentations there “Modernizing Arc GIS Web App Builder Apps Using Experience Builder”, “Introduction to R Programming”, and “The Story of Waters at the Missouri DOC and the new hydrography and wetland modeling”. I liked the Intro to R presentation, and I liked the others too, but they were overwhelming for me as it was designed for mostly GIS professionals.