library(tidycensus)
vars <- load_variables(2021, "acs5")
grad_education<- get_acs(
geography = "county",
variables = "DP02_0066P",
year = 2021,
survey = "acs1" #<<
)
library(tidyverse)
arrange(grad_education,estimate)
arrange(grad_education,desc(estimate))
grad_education_Iowa <- grad_education%>%
separate(NAME, into = c("county", "state"), sep = ", ") %>%
filter(state == "Iowa") %>%
arrange(desc(estimate))
ggplot(grad_education_Iowa, aes(x = estimate,
y = reorder(county, estimate))) +
geom_errorbar(aes(xmin = estimate - moe, xmax = estimate + moe),
width = 0.5, linewidth = 0.5) +
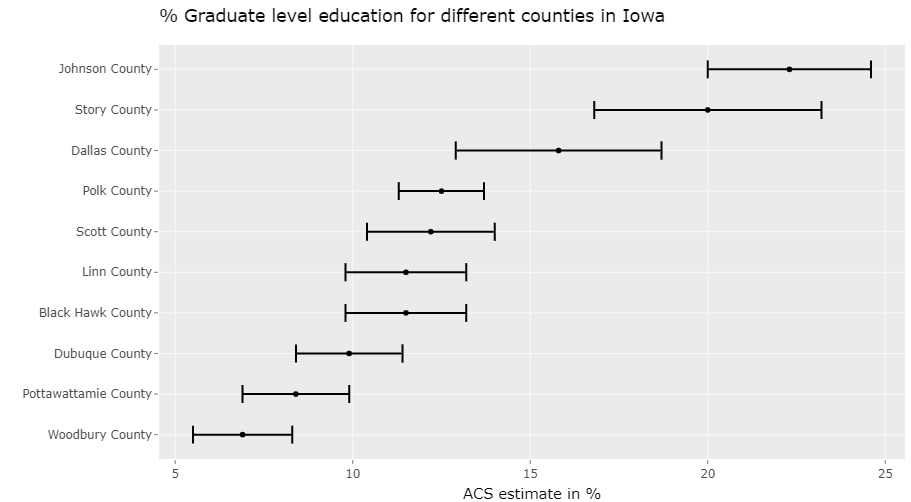
labs(title = "% Graduate level education for different counties in Iowa",
x = "ACS estimate in %",
y = "")+
geom_point(size = 1)
library(plotly)
ggplotly(tooltip = "x")General Overview
I printed my first “Hello World!” in R this week! started learning about the general syntax for the various operations in R. Learning both R in general and data analysis parts of R. I am also exploring how to make my blogs look better, like adding pictures, headings, bolding, adding code blocks, etc.
Analyzed some ACS data using Tidyverse in R
Tried to find the percentage of people with graduate level of education in different Counties of Iowa