Our major task for this week was to create functions and document them. We also created a flow chart to understand the dependencies for the various functions from the user input or from the other functions.
Created Functions
I learned to create functions in R. Then I recreated all required functions to calculate Revenue from the client-shared Excel Sheet. Functions Created:
Avg_Capita_Grocery_Spending()
Adj_Capita_Grocery_Spend()
State_Adj_Capita_Grocery_Spend()
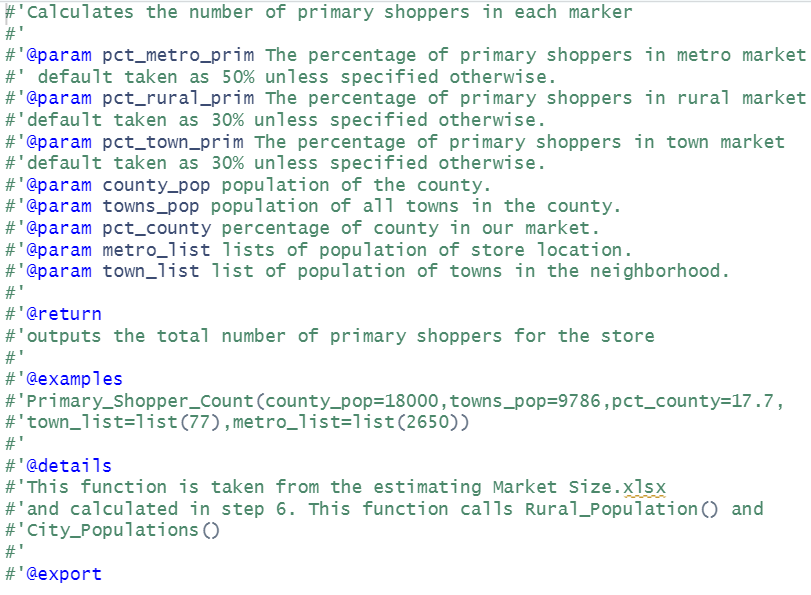
Primary_Shoppers_Count()
Secondary_Shoppers_Count()
Rare_Shoppers_Count()
Total_Spend_Primary_Shoppers()
Total_Spend_Secondary_Shoppers()
Total_Spend_Rare_Shoppers()
Total_Estimate_Revenue()
Documenting Functions
This week I learned how to use the Roxygen package to document the functions created in R.
Flow Chart
After my teammates and I created our functions, we created a flow chart that helped us visualize where the functions are getting dependent on each other.
.jpg)
Guest Presentation
On Friday, we had a Guest from Oklahoma State University visiting us. So we did a Recap of work done so far and we presented that to him.