For the first 2 days of this week, we collected data for the WINVEST project. My major task for this week was creating plots using the grocery store and dollar store data from Sales Genie.
Visualizations
The following plots show the distribution of stores in cities of Iowa with more than one chain grocery store and non-chain grocery store, respectively. I am currently working on improving this plot by trying to make a single plot that contains the distribution of the stores color-coded by the type so that we can see if there are any trends that we can observe about the presence of one type of store affecting the other(like if dollar stores affect the non-chain grocery stores).
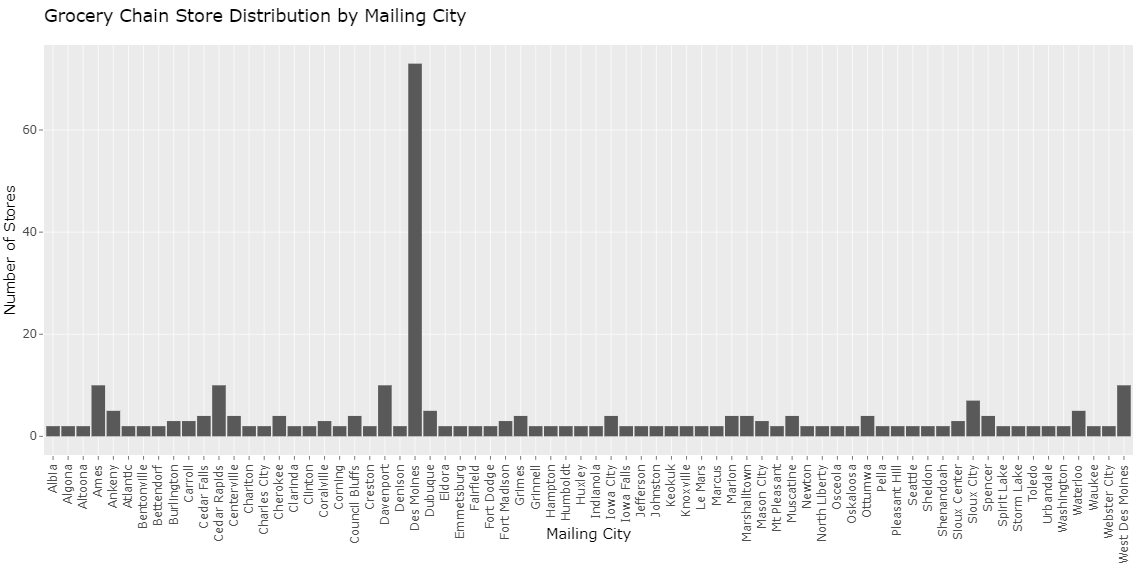
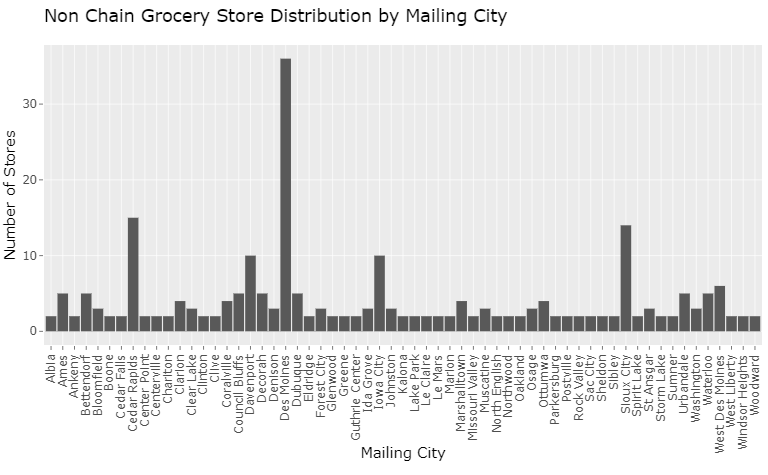
From all these plots, one common thing that we can observe is that irrespective of the type, there are usually more stores in big cities than in small cities, as we would expect.
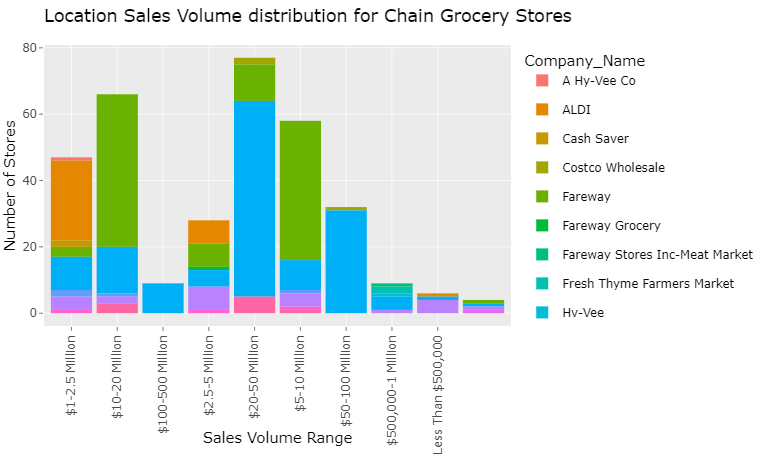
The above plot shows the distribution of the number of stores by Sales volumes for the major chain grocery stores in Iowa. I must do data cleaning and arrange the x-axis titles in ascending order to make them more interpretable.
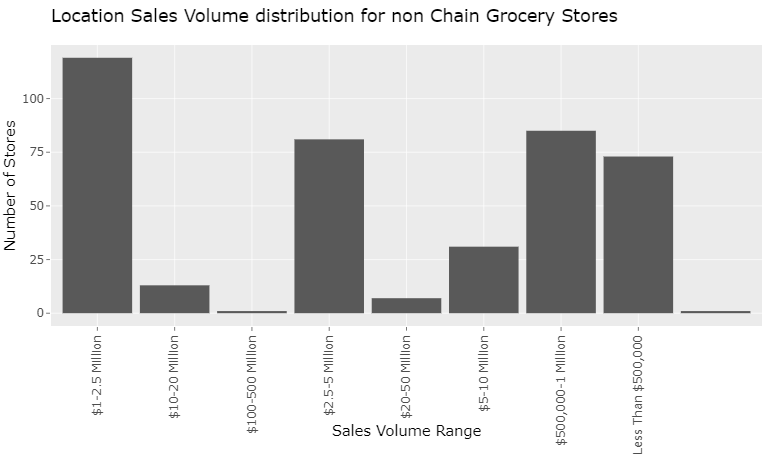
The plot shows the location sales volume for the non-chain grocery stores. We can see that many of the non-chain grocery stores have a 1-2.5 Million sales volume.